
My goal in managing this website is to help individual investors to increase their wealth by discovering tomorrow’s top performing stocks before the market does.
My basic premise is this:
Companies that generate consistent, above-average percentage increases in year-over-year revenue growth will almost always produce higher stock market values.
My qualification for pursuing this wealth-building goal is that I have self-published three books relating to investing. My most recent book is Investing in the Age of Digitalization. It is available on Amazon.com.
My performance.
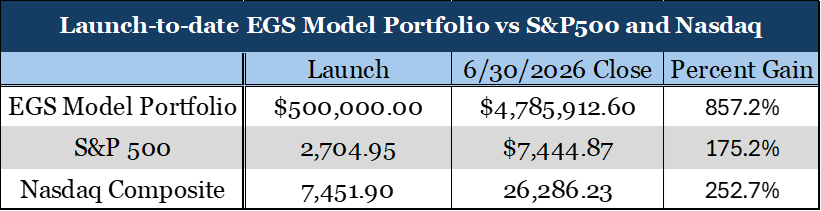
To demonstrate the efficacy of my skills in discovering stocks with extraordinary growth potential I launched the EGS Model Portfolio (Extraordinary Growth Stocks) in July 2018.
Have I been successful in my discovery efforts?
My Launch-to-Date performance, as of the end of June, 2026:
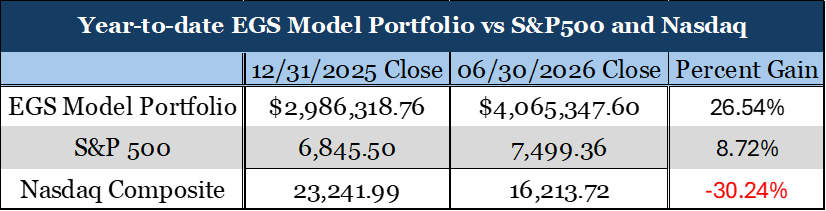
My Year-to-Date performance, as of the end of July, 2026:
Keep in mind that almost every institutional investment management firm – including hedge funds – aspires to match or exceed the performance of the S&P 500 and most of those firms demonstrably fail to achieve that goal.
The following stocks did most of the “heavy lifting” for my EGS Model Portfolio:
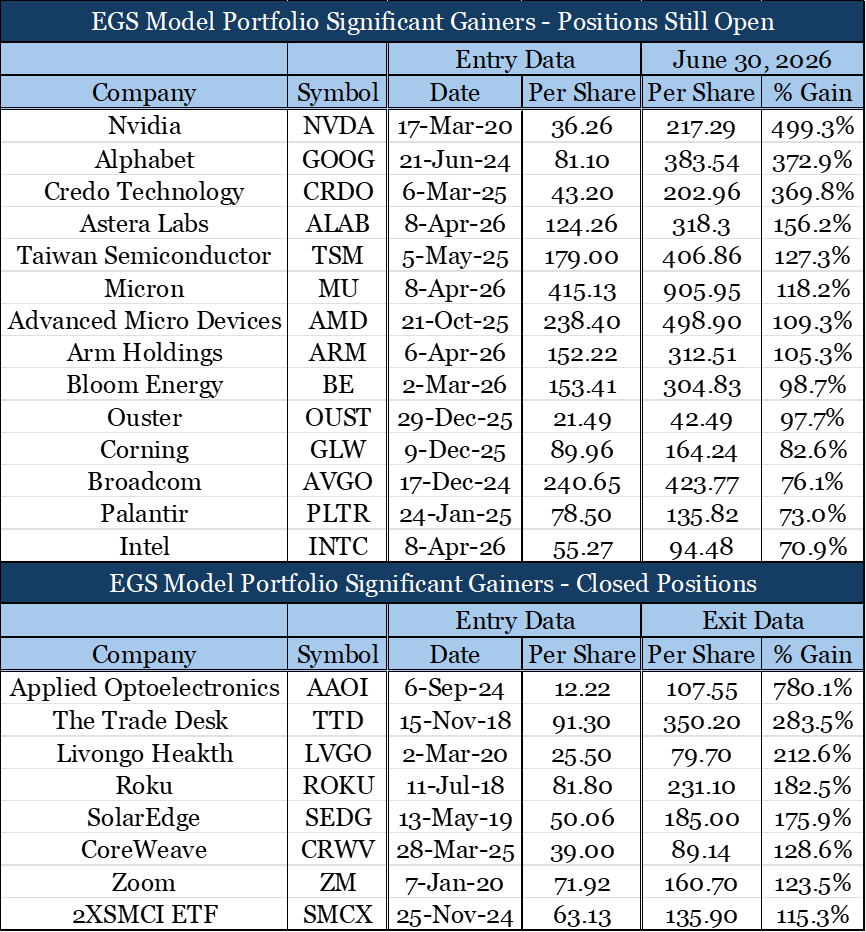
While most individual investors are familiar with NVDA, GOOG, ZM and ROKU, I would suggest that very few would be familiar with AAOI, NET, CRDO, LVGO, CRWV, SEDG, SMCX and TTD. Interestingly, every one of those stocks at least doubled in stock market value!
You are invited to participate in a FREE one-month trial subscription.
All I need is your email so you can be added to my Distribution List, which offers relevant research reports and any additions/deletions made to the EGS Model Portfolio.
At the end of the one-month trial subscription, you will have the option of either becoming a subscribing Member – or not. If the latter, I will simply remove your name from my Distribution List – period.
No need for credit/debit card entries – ever, unless, of course, you become a subscribing Member.
To participate in the FREE one-month trial subscription, just send me your email address at the following address:
paul@uvmetrics.com
Note: We do not share your personal information with any other entity.
UV Metrics does not make recommendations or solicitations for the sale or purchase of any security – ever.
We are not licensed to do so and wouldn’t do it even if we were.
We share research to enable you to become more knowledgeable when making your own decisions.